Every workplace is different, with unique business challenges based on their various products, processes, policies, promotions, and people, especially, from a big picture perspective. However, we can identify some similarities.
Thai Employees Generally Satisfied With Their Workplaces
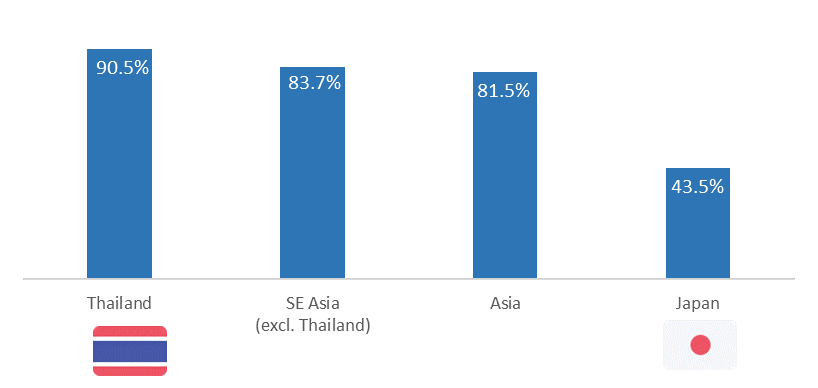
According to our latest Global Business People Survey, we’ve found some key characteristics and expectations of Thai employees, regarding what makes a great workplace. Overall more than 90% of Thai employees agreed that their “company is a great place to work for.” Compared to Asia’s average, this number is quite higher. While this may seem to suggest that Thai companies are already doing well in creating great places to work, it also implies that employee expectations are higher. In addition, One thing that needs to be noted when seeing this result is that the unemployment rate in Thailand is relatively lower than other ASEAN countries. This has enabled employees to explore new job opportunities more. Also, the culture of changing jobs in order to gain increases in compensation and job titles, or even deciding to leave a company entirely rather than endure any unfavorable situations may artificially inflate these results. Therefore, companies need to be able to compete and clearly distinguish themselves in order to win the war for talent.
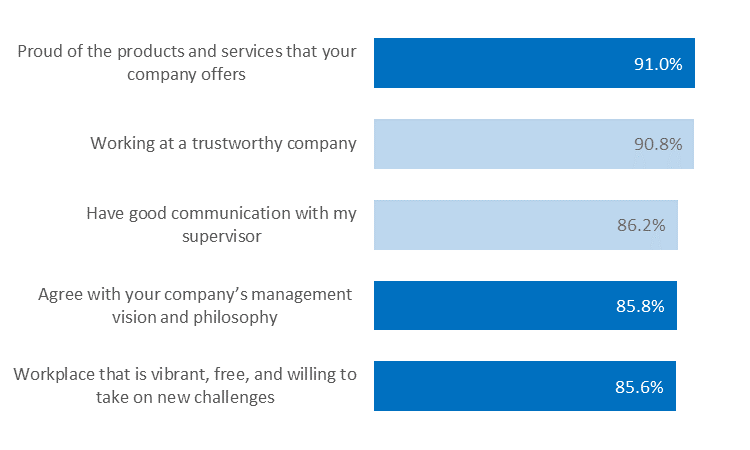
Furthermore, positive perceptions (percentage of respondents who answered “Strongly Agree” and “Agree”) were also seen in the following factors. Amongst these, “having pride in products / services offered”, “agreement with management vision and philosophy”, and “vibrant, free, and challenge-taking workplace” were most correlated with perceptions of their company as a great workplace.
Let us dig into the result of “I feel this company is a great place to work for” a little more deeply.
- Smaller Companies Face Bigger Challenges
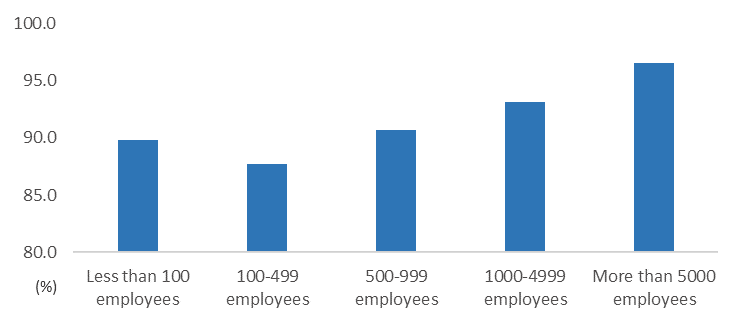
The result also indicates that companies of different sizes face different situations in Thailand. Although still small companies (less than 500 employees) showed high satisfaction, respondents of larger companies (more than 5000 employees) displayed much higher satisfaction. This may be due to smaller organizations lacking the systems and infrastructure, as well perception of lacking career opportunities within the organization. In order to grow, smaller companies may focus on building the infrastructure to better enable employees and create runways for their further development.
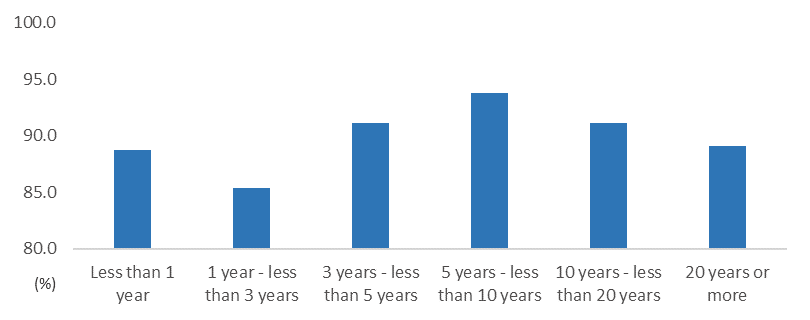
- Employee Lifecycles Affect Employee Emotions
Tenure also presented some interesting findings. Employees displayed fluctuating levels of satisfaction over the course of their company careers. After the initial “honeymoon” period, scores dropped to the lowest point for employees with 1-3 years of experience. Eventually, these scores picked up, peaking during the 5-10 year period. However, scores dropped again during the next decade, and even further for those with over 20 years of service. This illustrates the importance of managing employee expectations and experiences at different stages of their careers.
- Better Views From the Top
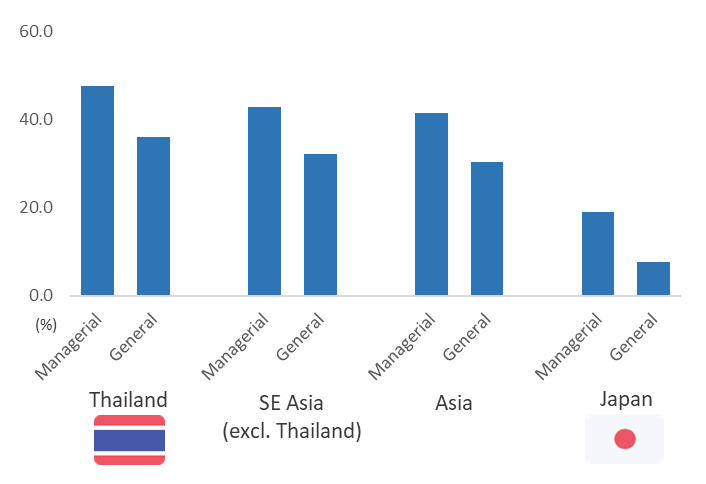
Role and title within an organization also played a factor. When looking at the scores of “Strongly Agree”, managers and above tend to be more satisfied compared to general staff levels. This is a normal pattern that we saw across Asia and Japan. This shows that Hatarakigai tends to decrease as we move down to lower levels of the organization, as information and updates are not clearly seen or completely shared. This suggests that leaders not only need to communicate effectively about what is happening within their organizations today but also help employees see how they can similarly grow into higher level roles tomorrow.
- Don’t Neglect Your Middle Managers
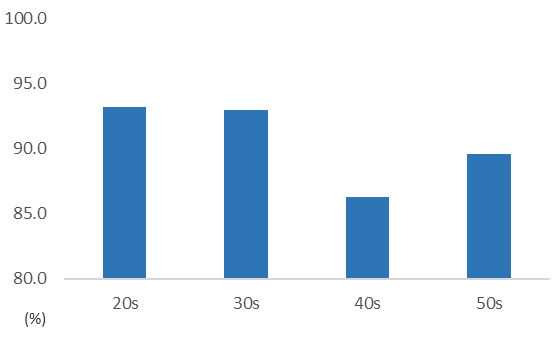
Looking at results by different age groups, employees in the 40s scored the lowest. For most organizations, this age group represents the middle manager level. The results are not surprising, as this group likely feels the most pressure to achieve the goals and objectives assigned from the top management, while managing the needs from general level staff. Understanding and respecting the different needs and challenges of different generations is a key ingredient for internal harmony and collaboration.
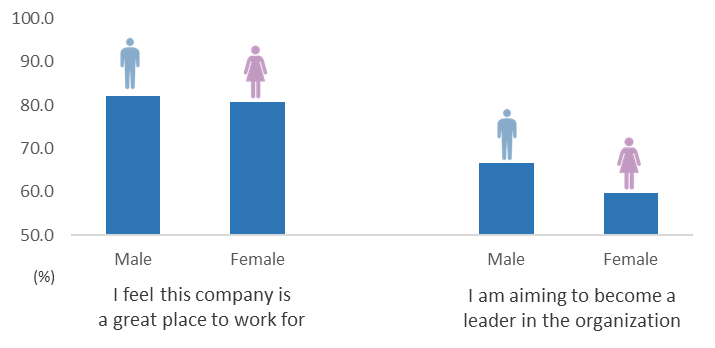
- Closing the Gender Gap
Lastly, gender perceptions saw a noticeable difference in scores. While overall, males and females scored similarly when asked “I am aiming to become a leader in the organization”, the gap widens significantly. Companies can ensure the sustainability by increasing both the overall score as well as opportunities for women.
Turning the Keys to Unlocking Hatarakigai
Building Hatarakigai, a feeling of meaningful work and a meaningful workplace, is possible with a deeper understanding of the expectations of employees. These findings present a roadmap for companies that strive to build Hatarakigai as a competitive advantage. We will explore each of these key factors in more detail in future blog posts.
*The Global Business People Survey was an online research conducted during October 2018 across 13 countries (Japan, U.S., U.K., Germany, France, China, Thailand, India, Vietnam, Indonesia, Malaysia, Philippines, and Mexico) with approximately 1,000 full-time workers for each country.